A confusion matrix is a machine-learning table used to measure the performance of a classification model. It contrasts the actual results with the predicted results, dividing them into four classes: True Positives (TP), True Negatives (TN), False Positives (FP), and False Negatives (FN). The tool is more informative than accurate by itself because it indicates where the predictions fail.
Analyzing these classes reveals a model's strengths and weaknesses, facilitating improvements. The confusion matrix plays a crucial role in improving machine learning models so that they can predict more accurately, particularly for activities such as medical diagnostics or fraud detection.
Breaking Down the Confusion Matrix
A confusion matrix breaks down predictions into four key categories, helping to reveal how well a model is performing.
- True Positives (TP): The model correctly predicts a positive outcome, and the actual result is indeed positive.
- True Negatives (TN): The model accurately predicts a negative outcome, and the actual result is also negative.
- False Positives (FP): The model incorrectly predicts a positive outcome for an actual negative instance, leading to a Type I error.
- False Negatives (FN): The model incorrectly classifies a positive case as negative, missing a true positive, resulting in a Type II error.
Knowledge of these pieces is important because they indicate where the model goes wrong. Too many false positives, for instance, might mean that the model is too eager to predict positive outcomes. At the same time, too many false negatives might mean that it is neglecting vital cases. The effect of these mistakes is situation-dependent.
Consider a medical diagnostic model, for example. If it produces too many false positives, patients are unnecessarily treated. On the other hand, if false negatives are common, true cases of a disease can be missed, endangering patient health. A confusion matrix enables us to identify these problems and make changes, enhancing the model's accuracy and performance.
Evaluating Model Performance Using a Confusion Matrix
One of the primary reasons for employing a confusion matrix is that it provides more than accuracy. Although accuracy quantifies the total number of correct predictions, it does not necessarily reveal the complete picture. A model may look very accurate yet still be lacking in important respects. This is especially the case when dealing with imbalanced datasets, where one class far outnumbers the other.
Several metrics are derived from the confusion matrix to give a clearer picture of performance:
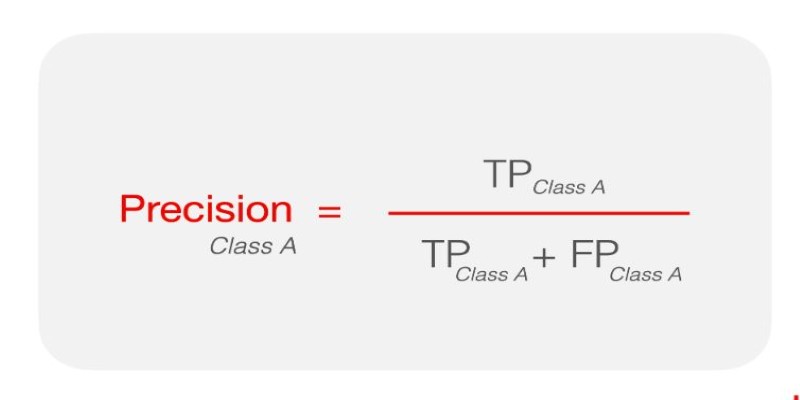
Precision—This metric focuses on how many of the predicted positive cases were actually correct. It is calculated as TP / (TP + FP). High precision means fewer false positives, which is critical in areas like spam detection.
Recall (Sensitivity) – This measures how many actual positive cases the model successfully identified. It is calculated as TP / (TP + FN). A high recall ensures fewer false negatives, which is crucial in scenarios like medical screenings.
F1-Score – This combines precision and recall into a single number. It is calculated as 2 × (Precision × Recall) / (Precision + Recall). The F1 score is particularly useful when precision and recall need to be balanced.
By analyzing these metrics, we can better understand a model’s strengths and weaknesses. For example, in fraud detection, a high recall is often preferred because missing fraudulent transactions can be costly. However, in spam filtering, high precision is essential because misclassifying important emails as spam is undesirable.
Beyond individual metrics, visualizing a confusion matrix can help spot trends. A well-performing model will have high values along the diagonal, where true positives and true negatives reside, and lower values in the off-diagonal areas, where errors occur. Adjustments like tweaking decision thresholds or using better training data can help shift these numbers in a favorable direction.
Practical Applications of a Confusion Matrix
The confusion matrix is widely used across various domains, particularly in machine learning models designed for classification tasks. Some of the most common applications include:
Medical Diagnostics:
The confusion matrix helps evaluate the accuracy of models predicting whether a patient has a certain condition. It identifies correct diagnoses and highlights critical misclassifications, improving the model’s precision to avoid life-threatening mistakes in healthcare settings.
Spam Detection:
Email filters rely on the confusion matrix to identify whether messages are spam or not. By analyzing false positives (important emails marked as spam) and false negatives (spam emails escaping the filter), the matrix helps refine the filter to avoid mistakes and improve accuracy.
Fraud Detection:

In fraud detection systems, banks and financial institutions use the confusion matrix to analyze whether suspicious transactions are correctly identified. By examining false positives and negatives, models can be fine-tuned to detect fraud accurately while minimizing unnecessary alerts and disruptions.
Sentiment Analysis:
Businesses use machine learning models to classify customer reviews into positive, negative, or neutral categories. The confusion matrix helps assess how often the model misclassifies reviews, providing insights into where improvements are needed for better customer sentiment understanding and marketing strategies.
This tool's importance extends beyond checking a model's performance. It provides a way to refine machine learning algorithms to minimize costly errors. By adjusting model parameters, fine-tuning data, or even choosing different algorithms, results can be significantly improved.
Conclusion
The confusion matrix is an essential tool for evaluating machine learning models, providing a detailed and comprehensive view of prediction accuracy. Breaking down predictions into true positives, true negatives, false positives, and false negatives helps identify where a model excels and where it needs improvement. Beyond simple accuracy, the confusion matrix allows for a deeper understanding of a model's strengths and weaknesses, guiding adjustments to enhance performance. Whether in healthcare, finance, or other industries, using this tool ensures better decision-making and more reliable outcomes, ultimately driving the development of more accurate and effective AI systems.